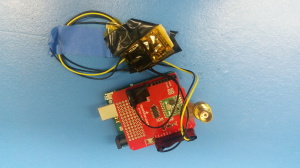
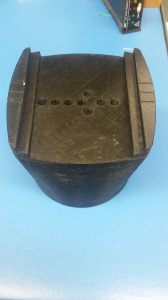
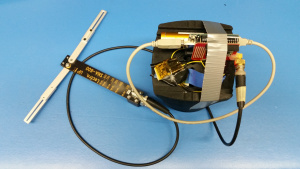
These tests were run on the rooftop of a building at UCLA. The transmitter and
receiver were separated by some distance and the transmitter was spun around
on a turntable.
Note: The absolute received power level for these tests is uncalibrated and should be interpreted as dB with an arbitrary offset.
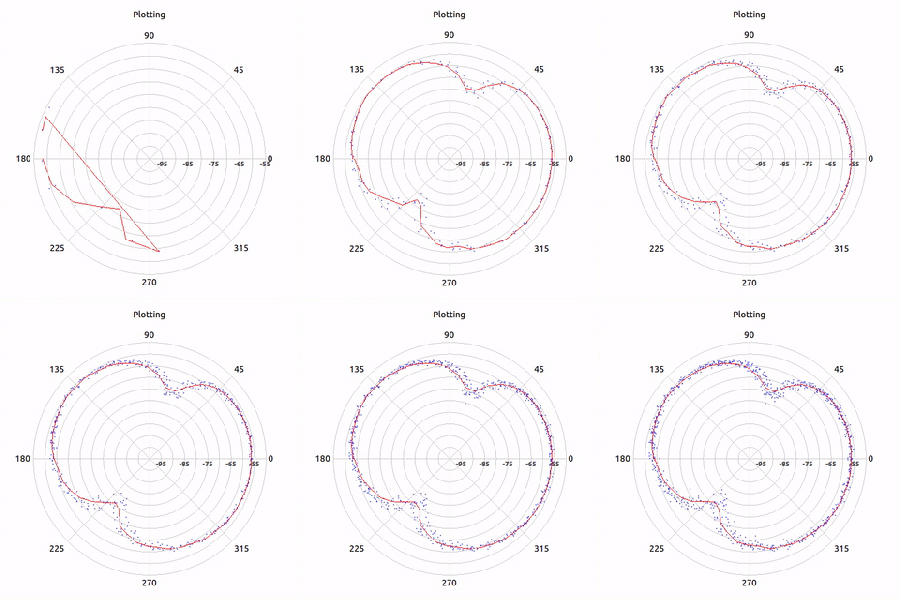
This is the plot produced when using a dipole antenna. This plot demonstrates
that our plotting software is functioning as expected (since the plot of a
dipole is known).
This is the plot produced by rotating our RF model of the satellite. In this
diagram we can see the nulls from our antenna configuration.
Testing Setup and Software
Hardware Equipment:
Adafruit LSM303 (Accelerometer+Magnetometer)
USB Battery Supply
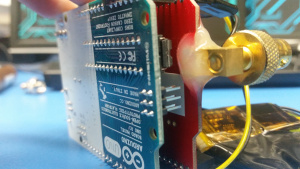
Epoxy the connector after soldering for mechanical strength. The electrical quality of this connection is very important! Scrape away the solder mask, and then solder the connector. Test the unit to ensure it works well, then solder the connector to prevent wear and tear.
Libraries Used
Adafruit LSM303 (needs to be modified)
In Adafruit_LSM303.cpp, change the begin() function to increase the precision and sample rate of the magnetometer.
bool Adafruit_LSM303::begin()
{
Wire.begin();
Serial.println(“Wire”);// Enable the accelerometer
write8(LSM303_ADDRESS_ACCEL, LSM303_REGISTER_ACCEL_CTRL_REG1_A, 0x27);// Enable the magnetometer
write8(LSM303_ADDRESS_MAG, LSM303_REGISTER_MAG_MR_REG_M, 0x00);
//Increase Sample Rate
write8(LSM303_ADDRESS_MAG, LSM303_REGISTER_MAG_CRA_REG_M, 0x1c);
//Enable high precision mode:
byte to_mask = read8(LSM303_ADDRESS_ACCEL, LSM303_REGISTER_ACCEL_CTRL_REG4_A);
to_mask |= 1<<3;
write8(LSM303_ADDRESS_ACCEL, LSM303_REGISTER_ACCEL_CTRL_REG4_A, to_mask);return true;
}
Wire.h (modified)
In \Arduino\libraries\Wire\utility\twi.h
Change
#define TWI_FREQ 100000L
into
#define TWI_FREQ 400000L
Computer
Radioplotter is a python application capable of processing and recording orientation and signal strength data obtained from the receiver while plotting in it real time. There is a configurable averaging function to deal with noisy data by averaging it over a specified sized interval of angles. Recorded data can be processed and graphed immediately or played-back at a configurable rate. More details are in README.TXT
Source code: RadioPlotter-0.01.tar.gz

